The wait is almost over! (We’re going live with REW Deals in Beta this month!)
This is the biggest update to REW CRM since… well? Since REW CRM!
Very exciting!
There is a lot in there to cover and so I wanted to start with the main deals dashboard/screen.
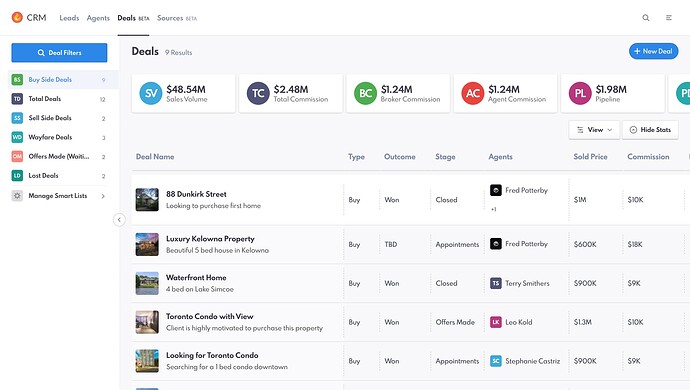
Here’s a screenshot:
The UI works the same way as our award-winning Leads / Agents UI in that it uses a powerful query engine, smart listings, and custom view management to allow customers to personalize thier user interface experience. If you’re already a REW CRM power user, you will already be familiar with those concepts.
Let’s start with timeline: If no timeline is selected via filters, then it will show all time, however, the first filter I imagine everyone will set is the timeline filter so that you can view deals from this past quarter, year to date, etc.
Now the first thing you’ll notice are those cards on top (would it be too cheeky to refer to them as “report cards”? heh
Anyways, the purpose of those cards is to provide you with a visual summary (at a glance) of the most important KPI’s around deals.
Here are what each card contains:
Sales Volume: The sum of the total deals marked as closed/won in the system from that time period.
Total commission: The sum of all commissions earned from deals (before splits) by the organization.
Broker Commission: The portion of the commission split that went to the brokerage (if you’re a team leader, you take the spot of the broker in this example, so how much commission went to the house basically)
Agent Commission: The portion of the commissions that have gone directly to agents.
Pipeline: The sum of all deals “not” closed but in some stage of negotiation. Deals that could potentially close. In the example of a listing where there are multiple offers, we take the “average” of the offers to calculate the contribution of that listing to the pipeline.
Pending Deals: A count of how many deals are in “pending” status which means they have accepted offers with subjects removed but have not reached their closing date yet.
In future versions (once we’re out of beta) I have an idea to add more cards (such as how many appointments in the timeframe, how many offers that sort of thing) and then have an interface to allow these cards to be turned on / off and re-organized by users (personalize your view even more) but for now for the beta, these are the decided cards. (We welcome your input on what you’d like to see in future versions)
Individual deal components on the dashboard:
Next, let’s look at some of the individual components you see on the dashboard for deals. I’ll screen cap for visual
Starting left to right on the screen:
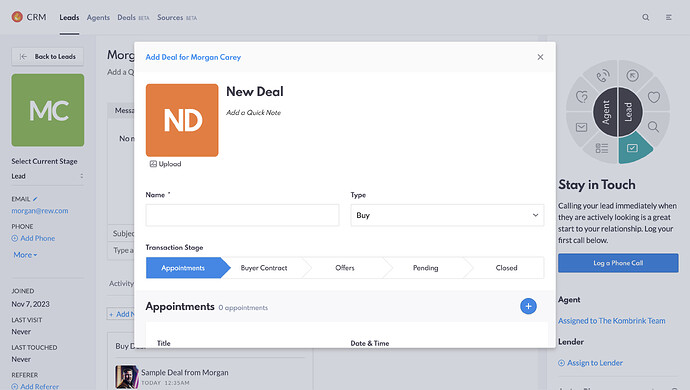
Deal Name: The first thing you see is the deal name field: This is a field you manually input at the start of the deal. It can be edited at any time. You can also create a quick note or description that follows you around the various components and you can even upload a photo which again can be anything (if it’s a listing deal maybe a picture of the house, if it’s a buyer deal, maybe a picture of your buyer). Up to you!
Type: The next column is Type: For Beta, we have included buyers and sellers however we will expect later leases and other types as well. This shows what type of deal it is.
Outcome: There are 3 options here. Won, Lost or TBD. When you’ve closed a deal it is flagged as won, if you lose a deal for some reason, we still want to see it in reporting so it is shown as lost, and if it’s TBD (To be determined) well… that is self-explanatory. It’s in progress.
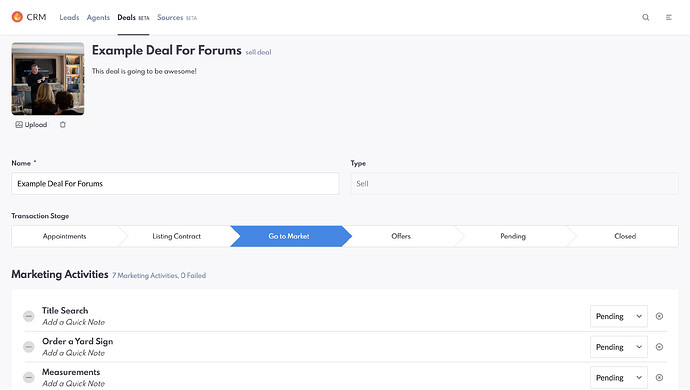
Stage: One of the most exciting workflow pieces of REW Deals is stages. This one deserves a screenshot and I’ll go into much more dept later) but the idea is that each deal type has various stages it goes through.
Seeing which stage each deal is in at a glance is super helpful for knowing approximately when you might get a closing, but also for training and accountability, it’s massively beneficial to be able to know where deals are falling off so we can focus on training and attention on those areas with our agents.
This was one of the things we loved the most about our time with Salesforce is the ability to move deals through their logical stages. It’s one of that CRM’s best features.
For now with Beta - stages are fixed. Selling / Listings have: Appointments, Listings Contract, Go To Market, Offers, Pending, and Closed. Buyers have Appointments, Buyer Contract, Offers, Pending, Closed.
No stage is mandatory (you can go straight to closed if you want for example if you’re backfilling deals from the past and don’t know all the interim steps) but for new deals, to train agents property, we want to ensure they are using stages as intended as it will really help them stay organized and give the company or team leader great data.
Agents: Who does this deal belong to? You can use the filter system/query engine to search one or more agents, create groups of agents etc for 1 click reporting on segmented groups or individuals
Sold price: This is the final sale price on any deal. Will be $0 if the deal hasn’t closed yet.
Commission: The total commission on that specific deal.
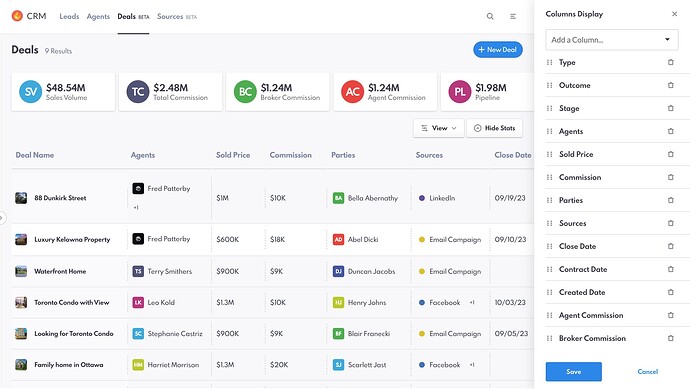
Parties: Who is involved in this transaction? The system supports multiple parties as long as each is entered into the CRM.
Sources: If you aren’t using source/budget attribution yet, you need to get on it! It’s a massively beneficial new feature in REW CRM and it is part of the secret sauce of how we can now tell you exactly which sources of leads are giving you the best ROI. It’s a whole feature itself so we’ll link that later in the comments. But in terms of this UI, the column shows which source or sources the lead came from.
Not shown in the screenshot but also available in Beta on your dashboard:
Created Date (when you first created the deal), Contract Date (When you got a signed buyer or listing contract), and close Date (when it is set to close).
And finally, you have Agent Commission (per deal) and Broker Commission (per deal).
And it’s all customizable, just like REW Leads!
That’s right - as I mentioned in the beginning… while we set a default view for you, you can completely customize your dashboard and decide which columns you want to show vs hide, which order you want them in, and even how they sort when you load the view.
The columns are sortable and you can create your own smart lists in order to have single-click reporting based on saved criteria from the query engine.
